![]()
Learning Disabilities Statistics
Some recent Canadian sources for statistics on learning disabilities
Preamble
In the field of Learning Disabilities (LDs), statistics on incidence rates can be particularly vulnerable to distortion or bias for a number of reasons. For example, there is no precise operational definition of learning disabilities that is widely accepted, with the result that studies are inconsistent in how they define what they are measuring. Similarly, studies vary in how they treat the disorder known as ADD/ADHD. Some include this as a specific type of LD involving attention, memory and concentration, others partial it out a separate but related and often co-existing disorder, while still others don’t mention it at all. Many incidence surveys are based on self-reporting, so their results depend on what the respondents understand about LDs, and also whether they are comfortable with disclosing. All these factors may help explain why estimates of the incidence rate of LDs range from as low as 2% of the population to as high as 10% or more.
There are other examples of potential biases and distortions in the way data can be interpreted. Therefore any statistical analysis should be interpreted with caution and only with a full understanding of the definitions and criteria used by the researchers.
Ministry of Education (EDU) statistics
- In the 2015-16 academic year; approximately 40% (39.8%) of students, identified as “exceptional” by an Identification, Placement and Review Committee (IPRC) in Ontario, were identified under the Communications/Learning Disability category and definition.
- The total percentage of students identified as exceptional was 8.8% of the school population. That would mean that 3.5% of the school population was identified for special education under Learning Disability in 2015-16.
- This figure does not take into account the large number of students who receive special education programs and services without being formally identified. In total, 17.3% of students in Ontario received some special education programs and/or services in 2015-16. If approximately the same percentage of these students had learning disabilities, then about 6.9% of students in Ontario publicly funded schools in 2015-16 would have learning disabilities (identified or unidentified).
Ministry of Training, Colleges and Universities (MTCU) statistics
Statistics from MTCU (from Colleges and Universities Year End Reports):
- College students with learning disabilities (excluding those in Apprenticeship programs) rose each year from 8,007 in 2008-09 to 10,971 in 2014-15. However, students with LDs comprised a decreasing percentage of the total number of students with disabilities served by the offices for students with disabilities (DSOs), from 33% in 2008-09 to 25% in 2014-15.
- University students with learning disabilities rose each year from 5,620 in 2008-09 to 7,064 in 2014-15. This number as a percentage of total number of students with disabilities served by DSOs declined from 42% in 2008-2009 to 36% in 2014-15.
The good news is that more students with learning disabilities are attending colleges and universities in Ontario. The concerning news is that there are more students with a range of disabilities who are served by offices for students with disabilities, and funding may not keep up to the increasing demand on these offices.
Transitions Longitudinal Study 2009
This study, begun in 2005, surveyed a cohort of students (initially about 200) who had participated in pilot transitions support programs from 1998 -2002 in one of the 13 colleges and universities in Ontario under the Learning Opportunities Task Force (LOTF). The longitudinal study shows that students with learning disabilities who got supports in postsecondary studies and answered the surveys had more favourable outcomes than those shown in the PALS research. For example:
- For each of the five years of the study, 10% or less of the participants left their programs without graduating, compared to 15% in the general population. For those who did not graduate, the most common reason was inability to pass required courses.
- The number of participants who returned to school after graduation each year ranged from 17% to 35%.
- The number of participants who were employed increased from 58% in 2005 to 82% in 2009.
- By 2009, 93% of participants who responded to the survey earned at least $20,000 and 53% earned at least $35,000.
- About half of the employed participants had disclosed their LDs at work and of these 96% found the reaction positive. 43% of employed participants did not feel that disclosure was necessary.
Canadian Survey on Disability, 2012: Learning disabilities among Canadians aged 15 years and older
In this survey, adults (15 and older) with a learning disability were identified as those who answered the question “Do you think you have a condition that makes it difficult in general for you to learn? This may include learning disabilities such as dyslexia, hyperactivity, attention problems, as well as other conditions” or “Has a teacher, doctor or other health care professional ever said that you have a learning disability?”
NOTE: Because it is based on self-reporting, the population surveyed may have included some with intellectual disabilities.
- The prevalence of learning disabilities ranged by age from 2.0 % to 3.1 % of the population, with an average of 2.3%.
- Learning disability rates among men and women were not significantly different.
- 96.3% of respondents who reported a learning disability also reported at least one other type of disability.
Education
- Among the respondents who were currently not attending school, 33% had not completed high school but 35.6% had completed postsecondary education.
- Among those who currently were in school or had recently been in school, almost all (98%) stated that their disability directly impacted their educational experience (The most common impacts were taking longer to achieve education milestones, changing their choice of courses or career, and taking fewer courses. Many also reported social difficulties, including being avoided or excluded, and being bullied).
- 51.4 % of respondents who recently attended school required some sort of ‘education aid or service’. Of these, 93.9% stated that at least some of their needs had been met, while 6.1% felt that none of their needs had been met.
- About 32.8% stated they needed at least one type of learning aid, such as computers with voice recognition, and of these 41.2% reported this need was not met, usually because the cost was too high.
Employment
- 39.2 % of respondents in the 25 to 34 age group and 37.2 % in the 35 to 44 age group were employed.
- Among those who were or recently had been employed, 55.5% stated they needed at least one type of work accommodation. Of these, 71.0% stated at least some of their needs had been met while on the job.
- Among those with employment income, median employment incomes for adults with a learning disability were less than half for those without any disability ($15,900 and $34,100 respectively).
Canadian Survey on Disability, 2012: Persons with disabilities and employment
NOTE: These statistics are not specifically for individuals with LDs.
- Among university graduates, the employment rate of those with a moderate disability (adjusted for age differences) was 77%, compared with 78% among those with a mild disability and 83% among those without a disability (Chart 2). The difference between university graduates with a mild or moderate disability and those without a disability was not significant.
- Conversely, the lack of a high school diploma may represent more of a barrier among those with disabilities. Among people who had not completed high school, 33% of those with a moderate disability were employed, compared with 50% of those with a mild disability and 65% of those without a disability.
- Only 40.6 % of children with LLs had all their needs for assistive technologies met, while 31.2 % had no needs met. Computers were the most common assistive device, and cost was the biggest factor in unmet needs.
www.statcan.gc.ca/bsolc/olc-cel/olc-cel?catno=89-628-XWE&lang=eng
Participation and Activity Limitation Survey (PALS), 2006
PALS is a Canadian national survey designed to collect information on adults and children who have a disability, whose everyday activities are limited because of a condition or health problem. It is based on self-reporting.
www.statcan.gc.ca/pub/75-006-x/2014001/article/14115-eng.htm
Learning limitations were defined as: Difficulty learning due to the presence of a condition, such as attention problems, hyperactivity or dyslexia, whether or not the condition was diagnosed by a teacher, doctor or other health professional.
Children (5 to 14)
- Among children aged 5 to 14, learning limitations (LLs) was the largest disability reported (about 69.3% of the children with disabilities).
- LLs affected 121,080 of the children aged 5 to 14, which is 3.2% of all children in this age group.
- Of children 5 to 14 in the survey who required special education, 89.6% did so because of LLs.
- 51.4% of parents who had children with LLs reported difficulty obtaining special education.
Putting a Face on Learning Disabilities (PACFOLD), LDA of Canada 2007 Report (www.pacfold.ca)
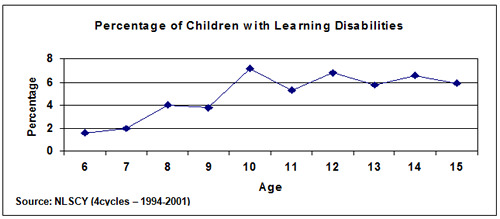
The National Longitudinal Survey of Children and Youth (NLSCY) began following a representative sample of Canadian children from birth to 11 years in 1994, with follow-up surveys conducted every two years.
PACFOLD summarized data for Ontario from the NLSCY, from 1994 to 2001:
- 2% of children aged 6 to 15 were reported by parents/guardians to have a learning disability
- 5% of parents of children with learning disabilities (LDs) said their child was doing well or very well at school, compared to 76.1% of parents of children without disabilities.
- 16% of children with LDs received help or tutoring outside of school, compared to 5% of children without disabilities
- 7% of parents of children with LDs said that their child had been diagnosed with emotional, psychological or nervous difficulties, while parents of children without disabilities reported only1% of such diagnoses
PACFOLD reported that 4.9% of Canadian children aged 6 to 15 had a learning disability according to the NLSCY. However, this figure varied across the age spectrum, from a low of 1.6% for children aged 6, to a high of 7.2% for 10-year-olds.
Other PACFOLD results:
- A significant number of youth and adults with LD had dropped out of the education system altogether, with over one-quarter of Canadians aged 22 to 29 with LD reporting less than a high school certificate as their highest academic achievement
- Persons with LDs were 2 to 3 times more likely to report fair to poor physical, general, and mental health, and 2 to 3 times less likely to report very good to excellent physical, general and mental health than the general population
- Persons with LDs were more than twice as likely to report high levels of distress, depression, anxiety disorders, suicidal thoughts, visits to a mental health professional and poorer overall mental health compared to persons without disabilities
SUMMARY OF LD Statistics
- Estimates of the incidence rate of LDs range as high as 10% or more of the population, but there is most statistical evidence from demographic sources for a range of 4 to 6 %.
- Figures from the Ministry of Education suggest that about 6% of students in the publically funded school system are receiving special education programs or services because of learning disabilities.
- The numbers of postsecondary students with LDs in both colleges and universities is increasing steadily, but their percentage of the caseloads of offices for students with disabilities is decreasing.
- Outcomes are promising for students with LDs who get the supports they need to reach postsecondary education and who receive supports in postsecondary.
- Employment rates for those who complete university is not significantly different from other students.
Learning Disabilities Association of Ontario
Tel: (416) 929-4311
Web: www.LDAO.ca
Document first created in February 2009, updated in February 2018